Custom Reports
To define your own reports:
1. Set the filters.
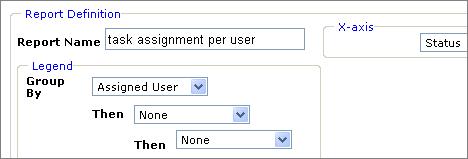
2. In the Report Definition area, click New.
3. Type a name for the report. This is mandatory. It appears as a title at the top of the graph.
4. Make your selection in the X-Axis area and in the Legend area. Please see the samples below.
5. Click Preview Results.
6. Continue perfecting the report. When finished, click Save.
This report is now permanently included in your list of reports and can be used in the future.
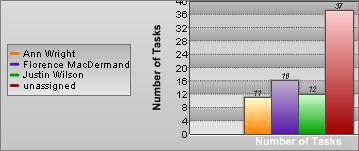
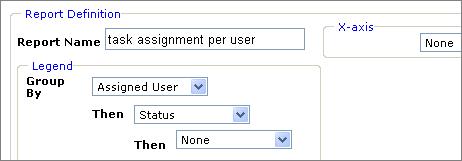
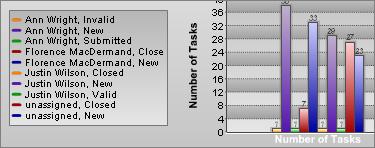
Example 1: Simple Report
Results
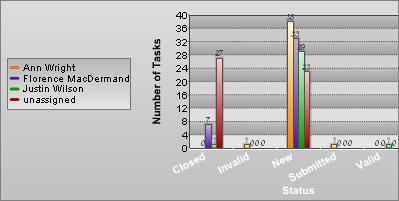
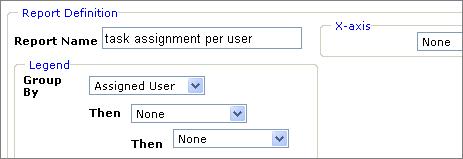
Example 2: Add a second level of grouping (more columns)
Results
Example 3: Single level of grouping and an X-axis category
Results