Task Analysis
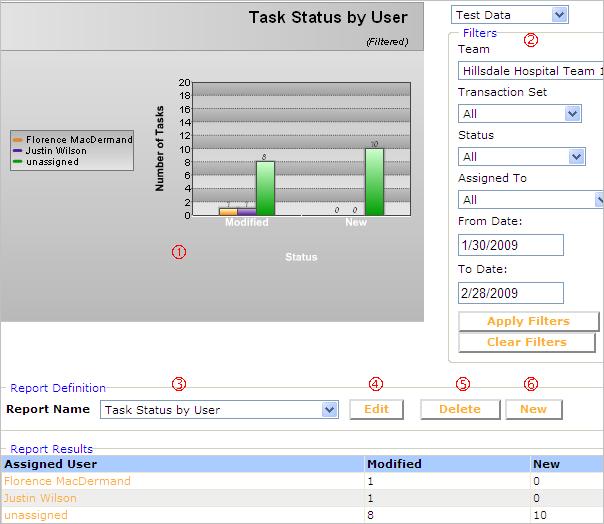
On the Task Analysis page, you can see various statistics about number of tasks for your team.
|
To do this … |
Do this … |
Number (see graphic below) |
|
View statistics about tasks in a chart and table |
Click Task Analysis on the main menu. |
1 |
|
Filter tasks |
Filters determine what data will be included in the statistics. Set any or all filters at the top right and then click Apply Filters. Type dates in MM/DD/YYYY format (example: 07/25/2009 is July 25, 2009. |
2 |
|
Define and save task reports |
Use the Report Definition area. See Define Reports. |
3 |
|
Display a line chart |
Use the Edit or New button under Report Definitions and select Line Chart and then Preview Results. |
4 or 6 |
|
Edit an existing report |
Select the Report Name, click Edit, change the settings, and click Save. |
3 and 4 |
|
Delete a report |
Select the Report Name, and then use the Delete button. |
3 and 5 |
 Define Reports