Specifying Dates on Statistics Pages
The Statistics pages let you specify the dates covered by the reports.
Selecting the Date Interval
Click the Day, Week, or Month button:
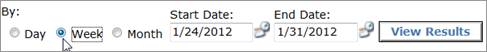
Day See data for up to 7 days.
Week See data for up to 7 weeks. Weeks end on Saturday.
Month See data for up to 13 months.
To update the page with the new interval, click View Results, Search, or Show Summary.
If the data for that interval and date range will not fit on the chart, TI changes the interval and displays a message at the top left.
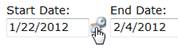
Typing a Date Range
1. Type the desired dates in the date area.
2. Click View Results, Search, or Show Summary.
If no error message appears at the top left, the page updates to show information for the dates you selected.
If you have selected Week or Month
as your interval, results show the entire week or month, regardless of the
ending day. Example: For monthly data, ending dates of
1-15-2012 and
1-30-2012 both show data for the entire month of January.
If a date is editable, you can open a calendar and pick a date rather than typing it:
1. Click the symbol at the right side of the date field.
2. Display the month by clicking the arrow to the right or left of the month.
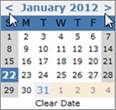
3. Click the day.
4. Click View Results, Search, or Show Summary to update the page.
The calendar control in TI is provided by Excentrics World. Please see www.eworldui.net for details.